


Ben Lipscomb
Commercial performance-based contractors know there are tons of opportunities in finding and fixing issues left behind by lower quality competitors, mother nature, and father time. By measuring performance, diagnosing, and fixing issues, you’ll see the opportunities for improvement and the impact you make every day. Do you ever wonder if the systems you work on are typical compared to systems across the nation? What about how the level of performance you typically achieve stacks up against your performance-based contracting peers?
Answering these questions helps us understand what level of performance is poor, just OK, or great. This helps us guide our customers to make the right decisions about what needs to be done and how much to spend. Should a customer with a system delivering 80% of its rated capacity invest more to get to 90% or 100%? Should a customer with a tired system replace the equipment, improve their duct system, or do they need to do both? What is the specific scope of work necessary to improve performance to an acceptable level?
We need to answer theses questions for every unique situation, customer, and system. Knowing where a system stands compared to a typical system provides context. This helps a customer understand their current system condition, where it could be, and how to get it there.
Typical Performance Data
Through our ComfortMaxx software, National Comfort Institute, Inc. (NCI) has collected performance data on thousands of jobs that allows us to gain insight into typical system performance nationwide. For this article we took data from more than 800 commercial systems tested prior to renovation work being performed. Contractors used pre-renovation performance measurements to help customers understand how their system is currently doing. It also helps justify the cost of the necessary upgrades to improve performance.
Undersized duct systems are the top contributor to low equipment airflow, which is the number one issue causing low equipment performance.
Using this data-driven sales process resulted in more than 400 completed renovation jobs. That’s a sales success rate of about 50%! Who knew performance testing could help you close one out of every two deals?
Let’s take look at the data to understand typical performance levels for existing equipment and systems before and after system renovations. We present this data in statistical charts called histograms. These histograms show the percentage of systems within different performance ranges. The performance metrics include the Cooling Equipment Performance Score (CEPS), and the Cooling System Performance Score (CSPS).
CEPS is the field-measured cooling capacity at the equipment divided by the equipment’s rated capacity under field-measurement conditions. The CEPS helps us understand how the equipment itself performs. The CSPS is the field-measured capacity at supply registers and return grilles divided by the equipment’s rated capacity under field measurement conditions. The CSPS gives us the performance of the entire system including equipment and duct system.
Cooling Equipment Performance Scores
Figure 1 below shows the percentage of systems on the vertical axis and ranges of CEPS on the horizontal axis. The bars give the percentage of systems performing within each CEPS range. The blue bars are for ‘Test In’ readings before renovations, and the orange bars are for ‘Test Out’ after renovations.
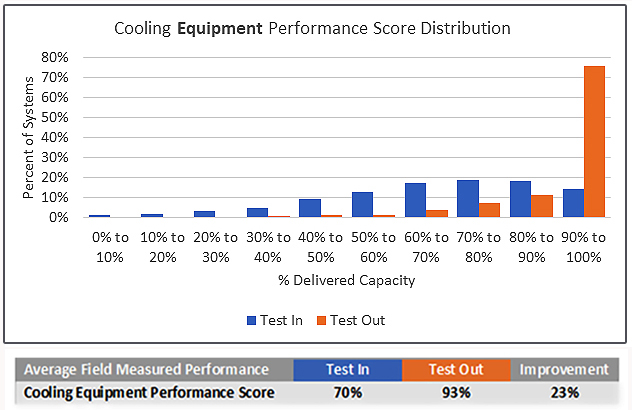
Figure 1
As an example of how to read the chart, we see that just under 20% of equipment tested in between 70% and 80%. We also see that only 7% of equipment tested out at this level after renovations were done.
From the table we can see that the average CEPS was 70% at test in. But the chart tells us that’s not the whole story. Almost as many pieces of equipment tested in between 80% and 90% as between 70% and 80%.
The shape of the Test In distribution is very wide and flat, which means your odds of guessing how a system is performing without measuring are not very good. As NCI likes to say, ‘If you don’t measure, you’re just guessing!?
On the other hand, the Test Out distribution is tall and narrow, with more than 75% of equipment testing out between 90% and 100%. Performance-based contractors can be reasonably confident they can bring the score up to 90% or higher.
Some of these contractors are so confident in their work that they offer a performance guarantee to customers. This guarantee promises the contractor will get performance to a certain level. They will keep trying until they do, or the customer doesn’t pay!
Cooling System Performance Scores
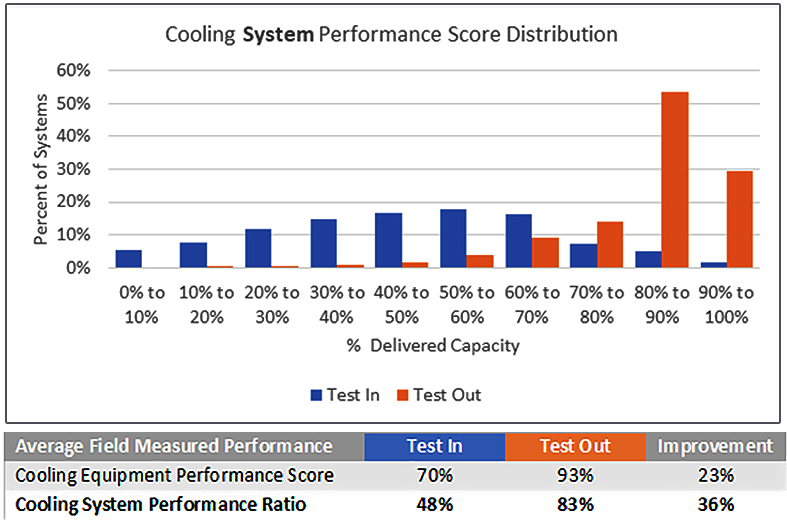
Figure 2
Now we’ll look at the same data for the system score, or CSPS. You’ll notice the same pattern in the shape of the data. The Test In distribution is wide and flat and the Test Out distribution is narrow and tall.
In addition, Test In system scores are much lower than the equipment scores across the board — 22% lower on average — indicating significant losses through the duct system plus poor equipment performance.
The Test Out system scores are still lower than the Test Out equipment scores, but there’s a much smaller gap of only 10% on average. This shows renovations significantly improved equipment operation and significantly reduced duct losses.
To realize the largest improvement, you need to consider the whole system. Even if your aim is to only improve equipment performance, you must evaluate the duct work to make sure equipment can ‘breathe.’
Undersized duct systems are the top contributor to low equipment airflow. This is the number one issue causing low equipment performance. In next month’s issue of High-Performance HVAC Today we’ll take a look at the top 10 issues that impact total system performance. We’ll then break down how you can diagnose and fix them.
In the meantime, I encourage you to use this data to show customers how their system stacks up against others around the country.
Tip: Even if you’re a residential contractor, or if you work on more heating than cooling systems, this data holds valuable information you can reference with your customers. NCI’s data indicates that there’s only minor differences between residential and commercial or heating and cooling performance scores.
Ben Lipscomb is a registered Professional Engineer with more than 14 years experience in the HVAC industry. This experience includes laboratory and field research, Design/Build contracting, and utility energy efficiency program design. He is National Comfort Institute’s engineering manager and may be contacted at benl@ncihvac.com.


Recent Comments