

In the world of Testing, Adjusting, and Balancing (TAB) airflow in commercial rooftop units (RTU), fans, and so on, there is a wide debate on which testing method to use. There are, in fact, two methods — Log Tchebycheff (Log-T) and Equal Area Method traverse ‘ and the debate centers around which is the most accurate. Most TAB professionals will say that either method is acceptable, but only one of them should be used on any particular job.

My purpose here isn’t to continue this debate. Instead, I want to highlight the impact of improper methods and/or inadequate documentation that can complicate results, no matter which method is used. There are a few clear indicators of this that I’ve encountered hundreds of times over the years.
First, some definitions. The
The Equal Area Method, on the other hand, simply divides the rectangle into equal areas. For the Y-Axis (the vertical line on a graph ‘ see Figure 1), you divide the exterior dimension by eight for the first hole or marking, and then you divide the exterior dimension by four for the second hole or marking.
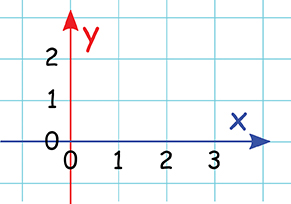
You repeat the process with the X-Axis or the horizontal line on the graph.
I saw a simple illustration in a SMACNA (www.smacna.org/) manual 20 years ago, and I never forgot it. Again, avoiding the debate over which method is more accurate, I’d like to point out that using Imperial, P/I units, a standard tape measure in the United States, doesn’t account for three decimal places. It does, however, include half’s, quarters, and eighths which you can use for the Equal Area Method. This results in greater accuracy and field technician repeatability.
With this in mind, here are five ways to spot bad traverses:
1. You Need Adequate Information to Evaluate the Data
Aside from the requisite number of velocity readings, are TAB professionals measuring and providing external duct dimensions, insulation size (if any), internal duct-free area, instrument(s) used, static pressure, type of unit and unit designation in their TAB reports?
Is there complete unit information to include all motor tag information, measured volts, amps, static pressure, motor, and fan rpm/fan speed settings?
Did the technician provide all the data? I mean, EVERYTHING?
When there are issues with a unit, ALL data, down to the motor bore size and sheaves are relevant. There is an annoying trend among TAB technicians to only collect partial data when encountering airflow issues. Step one in the troubleshooting process: collect ALL data as if the report is final.
2. Does the Airflow/Traverse Make Sense?
The professional approach is to question everything. Is the equipment a Make-Up Air Unit (MUA) showing a negative discharge static pressure? Ask yourself if the unit was in heating mode when the tech tool the reading with a thermal anemometer? Was it a 12′ x 12′ duct, with one-inch duct lining, and a recorded internal free area of 1.0 (That’s a difference in the free area of .694 square feet that will greatly impact the final numbers. It’s also a very common mistake)?
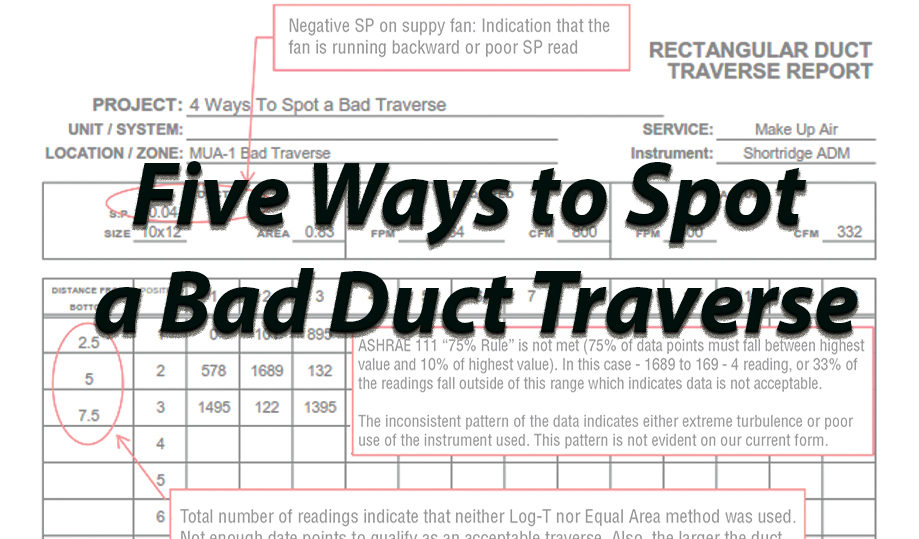
It is not uncommon to see irregular airflow or velocity readings in a supply fan duct traverse, with a negative static pressure reading on the fan discharge.
Although the laws of physics tell us this is not possible, it’s a common occurrence for multiple reasons. A negative static pressure reading on the fan discharge is accompanied by other poor readings. This can happen due to turbulence or excessive velocity.
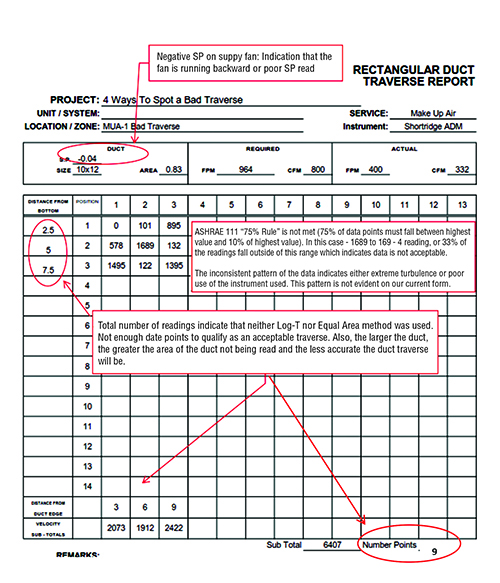
Starting with the latter, it is possible that velocity at the fan discharge is so high, that it is sucking in air through the static pressure port. Another possibility is that AMCA (Air Movement and Control Association) standards are not being met and system effect is occurring. When present, it will produce random negative static pressure readings and erratic airflow.
The final possibility has to do with forward curve centrifugal fans that run backward. They will still supply airflow, and not move air in the opposite direction, but only move 20% to 50% of the flow. This produces ‘choppy airflow’ patterns and negative discharge static pressure, where it is normally not possible.
3. Are There Enough Readings for a Good Duct Traverse?
On a rectangular duct, The Equal Area method requires a minimum of 16 readings on a rectangular duct traverse and the Log – Tchebycheff (or Log-T method) requires a minimum of 25 readings on a rectangular duct traverse. Yes, it is possible to obtain a ‘good’ traverse with only nine or 12 readings, but that not only shows a lack of professionalism, it opens the door to a greater possibility that the duct traverse data is unreliable.
4. Does Airflow Data Make Sense in Relation to Unit Data?
For example: Let’s say the unit is at full load amps, its static pressure is 120% of design, and fan rpms are 110% of design. But the duct traverse shows 50% airflow.
Next, you measure and read a 20′ temperature drop on a DX (Direct Expansion) Air Handling Unit (AHU) or Roof Top Unit (RTU). What? This is physically impossible and on DX units the coils ice-up around 70% airflow and below.
Keep in mind that the industry standard is 400 CFM per ton of air conditioning, or 12,000 BTUs (British Thermal Units). Also, as airflow decreases, the temperature difference increases.
Two other examples come to mind:
- Last year, I received a TAB Report that showed the unit at 50% airflow but had a 19.5′ temperature split when the design temperature change (‘T) was 20.1?. The traverse sheet was not included, so I could not evaluate the actual traverse. The indoor motor amp draw, fan rpm, and Total External Static Pressure (TESP), once plotted on the fan curve, indicated the unit was performing within 10% to 20% of design airflow.
Fan curves are not always accurate, as they are created under very strict laboratory conditions and can vary greatly from the design given installation conditions. I received the above-mentioned from a facility manager who was about to call the manufacturer and complain, but wanted a second opinion. I asked if he found the coils freezing up and if customer comfort complaints increased in the area served by this unit
Other questions included, how long the new unit had been in place (around six weeks by this point), and whether he could confirm the equipment entering and leaving dry bulb temperatures.
He responded that the coils weren’t frozen, the occupants were comfortable, and he had a 20? ‘T at the unit. Even without seeing the actual duct traverse data, I had a clear picture. All other data indicated the duct traverse data was wrong.
- In another situation that occurred very recently, a TAB contractor traversed a 7.5-ton unit, designed for 3,000 cfm. His traverse showed the unit moving 1284 cfm of airflow. The traverse was consistent with his balancing hood readings.
However, the ductwork on the mechanical drawings did not match the prints. The prints were ‘Straight Line Drawings’ and the ductwork had multiple transitions to overcome existing structural conditions.
He plotted airflow from the manufacturer-provided fan table, which indicated the unit was delivering between 2000 to 2400 cfm. His actual duct traverse sheet showed very good laminar airflow, which is a good indication that the traverse was done properly, at a good location, and acceptable.
The key element in confirming the duct traverse was the temperature drops. The fan curve proved to be unreliable due to installation conditions.
The RTU was designed for a 19.2′ dry bulb ‘T, and a 6.7’ wet bulb ‘T. Actual temperature readings were 27.1′ dry bulb, and 15.5’ wet bulb temperature.
Of further note, after an hour of operation, the coil froze up. All of these factors ‘ laminar flow with a 16-point duct traverse, temperature drops beyond design parameters, and a frozen coil indicated that the duct traverse was most likely accurate, in spite of the discrepancy with the fan curve.
If you encounter this situation, there needs to be A LOT of supporting data. It could be leakage at the curb, or it could be the wrong unit on the wrong curb. However, most of the time, it’s a bad duct traverse.
5. Does the Data Meet the ASHRAE 111 75% Rule?
The ASHRAE 111-2008 (RA 2017) ‘Testing, Adjusting, and Balancing of Building HVAC Systems rule (ncilink.com/ASHRAE111) states that for a duct traverse to be acceptable, 75% of the readings MUST be between the highest reading and 10% of the highest readings.
This is to say that if you have a duct traverse with 16 readings, and the highest reading is 1000 fpm, then 75% or 12 of those readings must be greater than or equal to 100 fpm.
For example, if the highest reading is 1000 fpm and six of 16 readings are ?78, 34, 89, 54, 69, 91? – THAT is NOT an acceptable duct traverse, per ASHRAE standards.
I could write so much more on this subject. However, the purpose of this article is to provide a broad overview so that a poorly performed, or improperly recorded duct traverse jumps off the page when reviewed by a TAB professional.
Technicians often don’t follow these simple rules. They should. The rules also apply to professional TAB Supervisors reviewing information from their own TAB technicians, the design team reviewing the TAB report, and even the end-user.
NOTE: As a TAB professional, you can find yourself accused of fabricating or ‘pencil whipping’ data in TAB reports. In most cases this is untrue. They aren’t pencil whipping. Bad data usually is due to poor practices, lack of knowledge on how to interpret the data in the field, and a general lack of proper supervision.
EVERY Certified TAB Professional, at the technician or supervisor level, must understand how to properly take the data in the field, and how to interpret it prior to publishing the report and certification.


Recent Comments